The 5 steps to survey design
Tyryn Carnegie
1. Introduction
Monitoring and evaluation (M&E) typically makes use of quantitative and/or qualitative approaches. Each approach has its own set of strengths and weaknesses, and where one has weaknesses, the other usually has strengths. Qualitative comparative analysis (QCA), a relatively new tool to M&E, is growing in popularity because it combines the strengths of each approach. In this blog post, we look at how QCA bridges quantitative and qualitative methods and discuss its advantages as well as its potential shortcomings.
2. Quantitative versus qualitative approaches
Quantitative data are expressed in numbers, for example units, prices, proportions, rates of change and ratios. On the other hand, qualitative data are expressed in words such as statements, paragraphs, stories and case studies.
Quantitative analysis methods are better suited to providing a broad overview of a situation and producing generalisable findings. They use established and standardised analytic approaches which means that anyone analysing the same quantitative data using the same techniques should produce the same results. Thus, the accuracy and reliability of results can be verified against objective standards, a feature that gives confidence in the findings.
Quantitative methods have their limitations, however. While they can effectively measure what has changed, uncovering how or why those changes came about can be challenging using a quantitative approach. Conversely, qualitative methods allow the researcher to ask subjects to explain the reasoning behind their responses, behaviour or situation, providing contextual information that can explain the change that has been observed. In other words, qualitative methods can be used to investigate causality, while quantitative methods are often restricted to measuring correlation.

However, just as quantitative methods face limitations, so too do qualitative methods. Data collection, usually conducted through interviews, focus groups and participant observation, tends to be time consuming, labour intensive and expensive. As a result, sample sizes are usually small, limiting the statistical representativity of the findings. Furthermore, qualitative analysis is more susceptible to researcher bias and can yield results that are difficult to replicate.
3. Qualitative comparative analysis: the best of both
QCA was developed in the 1980s by Charles Ragin, a professor of Sociology at Northwestern University. It is a mixed methods approach that bridges quantitative and qualitative methods.

QCA borrows from the quantitative methods, by identifying patterns across cases, while taking from qualitative methods a degree of in-depth knowledge of each case. The QCA method combines the context inherent to the qualitative approach with the ability of quantitative analysis to generalise and replicate results. Let’s explore how QCA works with an example.
4. A College mentorship programme
Imagine a programme that aims to increase the number of college graduates by pairing college students with qualified mentors. The programme assumes that positive role models can support students to finish college by guiding their educational and emotional development. An example of a theory of change (TOC) for such an intervention is shown in the figure below:
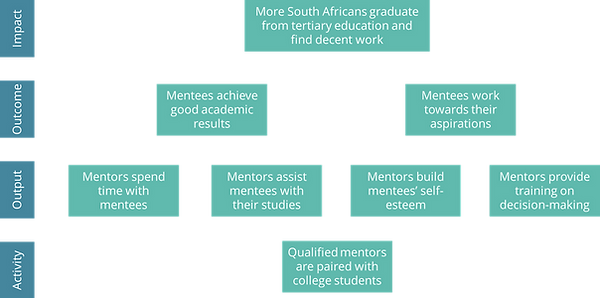
The programme’s activity - qualified adults being paired with college students in a mentor-mentee relationship - is intended to lead to the programme’s desired impact of increasing the number of youth who graduate college, potentially obtain further education and ultimately find decent work. As shown in the TOC, this occurs through a variety of outputs, which lead to the two stated outcomes, which then contribute towards the overall impact.
While the programme’s activity potentially contributes to the desired impact, it is unlikely to be the only factor that leads to school completion. Other conditions (i.e., assumptions and activities) left out of the TOC could include parental education, parental income, quality of schooling, learner ability, finances, motivation, and health.
A simple analytic model that focuses only on the activities included in the TOC would likely fail to capture the richness and nuance of learners’ progression through school. QCA accounts for this complexity by assuming that learners could pass matric through different combinations of the above activities (or conditions). QCA can assess causation that is complex, involving different combinations of conditions capable of generating the same outcome.

As a simple example, let’s pretend that there are only two pathways through which a student will be certain of graduating (these are used for demonstrative purposes in the example only):
-
They went to a good high school and have a positive role model, or
-
They are in good health.
The conditions above can be explained in terms of Set Theory (i.e. necessary and sufficient conditionality). The process of QCA determines which conditions are necessary and/or sufficient to bring about the outcome of interest (e.g. students graduating college).
5. Set Theory: necessary and sufficient conditions
In our example above, QCA finds two causal conditions that lead a student to graduate college:
-
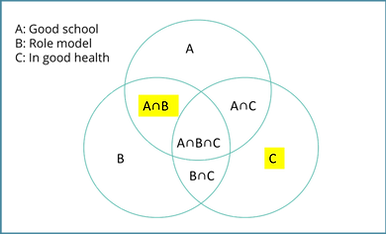
Having attended a good high school and having a positive role model is sufficient to ensure that a college student graduates. In other words, for any student who attended a good school, it is necessary for them to also have a positive role model to graduate. Attending a good high school alone would not be a sufficient condition to ensure college graduation.
-
The second condition assumes that if the learner is in good health this will be by itself sufficient for the student to graduate college. Any student who is in good health will graduate college, regardless of their high school's quality or whether they have a positive role model. A student who is in good health and went to a good high school will also graduate college, but in this case going to a good school is not a necessary condition.
These relationships can be displayed in a Venn diagram, where the minimum conditions sufficient to bring about the intended change are highlighted in yellow:
6. How QCA works
As with many analysis methods, QCA follows well-defined steps. However, the steps are not always carried out in the same order and can sometimes be carried out in parallel. In this section we give a brief overview of how QCA works.

a. Develop a detailed Theory of Change
When using QCA for non-profit M&E, it is crucial that a comprehensive Theory of Change (TOC) is developed. The TOC should identify:
-
The change the QCA study is interested in
-
The conditions (in theory) that help bring about that change.
This usually means that additional assumptions and activities need to be added to the non-profit’s TOC as critical inputs that could contribute towards the desired impact. When developing a TOC within the context of QCA, it makes it easier to replace and combine the typical TOC categories ‘Assumptions’ and ‘Activities’ into the single category ‘Input’.
Returning to our example of a college mentorship programme, this would mean adding inputs such as family income, quality of high school, and the students’ health. The existing input, ‘Qualified mentors are paired with students, could be replaced with ‘student has a positive role model’. This may aid the analysis as we would expect learners who already have a positive role model, such as an engaged parent, to receive similar benefits to those a mentor provides. The revised TOC could look something like this:

b. Select the cases
QCA is done using a sample of cases. In our example, we would define a case as a student. For the QCA algorithm to work, the sample needs to have cases with the inputs presented in the TOC, as well as cases without those inputs. This means that the sample needs to have students with a positive role model and learners without a positive role model, learners in households with sufficient income and learners in households with insufficient income etc. Similarly, the sample needs to have enough cases that show the TOC’s desired outcome and enough that do not. Therefore, the sample needs to have students that graduated college and students that did not.
c. Score the inputs
At this stage, we look at all the inputs and define when a case (i.e. student) displays them. If a case displays the input (e.g. the student has a positive role model), we give them a score of 1. If they do not (e.g. the student does not have a positive role model), we give them a score of 0. This stage is best done after all the required information has been collected on all cases included in the analysis.
This task often requires careful thinking involving desk research and consultation of experts. For example, how do we measure or know when a student really has the support required from a positive role model? Even for an input that is more objective, such as household income, how do decide what income is ‘sufficient’ for a household to provide the material needs required by students?
Assigning a binary score of either a 0 or 1 is known as a ‘crisp set’ presentation and has the advantage of being simple. However, given the nuance present in real life, we may prefer to assign scores that can vary when inputs cannot be simply classified as present or absent. When using this ‘fuzzy set’ procedure, inputs can have scores that can range from 0 to 1 (instead of 0 or 1). Thus, we could decide to assign 1 to learners with ‘high’ household income, 0.5 to learners with ‘medium’ household income, and 0 to learners with ‘low’ household income.
d. Analyse the data
At this stage, we calculate the ‘causal recipe’ of inputs that bring about the observed change in the outcome of interest. Unless the QCA is very simple, this is usually done with software that can rigorously apply the Boolean algebra and Set Theory mathematics needed to arrive at the solution.

The most widely used software is fs/QCA, available online for free, but evaluators with a coding background may prefer to use Stata or R’s QCA packages. If you are interested in a detailed explanation of how the QCA algorithm works, check out this great resource.
e. Interpret the findings and revise the TOC
At this stage, the software will produce a ‘causal recipe’ of input combinations linked to the outcome. This solution is usually presented in Set Theory notation. In our example, this would mean a solution that looks like:

where A stands for attending a good school, B is the presence of a role model and C is being in good health. In words, the above means that a student graduates college if:
-
She goes to a good school and has a positive role model, or
-
She is in good health.
Now that the evaluator has QCA output, she needs to go back to the data and decide whether the output makes sense. This often involves reviewing the inputs included in the study and the scoring criteria, and deciding whether the TOC needs to be revised. In some cases, it might be necessary to collect more data, especially when there are cases that do not conform to expectations. Thus, QCA is an iterative process often involving several rounds of reviewing the software’s output, the cases, and the TOC.
7. Strengths and weaknesses of QCA
Strengths
-
Most qualitative approaches (at least implicitly) incorporate the realistic notion that there are necessary and/or sufficient conditions for an outcome to come about. QCA makes this notion central, meaning that the approach offers a systematic way to analyse complex causality and logical relations between causal inputs and an outcome. This contrasts with the simplistic causal reasoning typically used in purely quantitative approaches.
-
QCA’s systematic comparison lets qualitative evaluators work with larger samples than typically feasible (15-50 cases as opposed to less than 15 cases). The approach makes it possible to combine in-depth qualitative analysis with systematic comparisons across cases, thereby allowing evaluators to identify patterns of causality. This strengthens the evaluator’s findings as it means that they can point to many cases where certain inputs produced an outcome, rather than just a few cases as would be typical in a purely qualitative approach.

-
QCA follows well-defined steps in a quasi-experimental design. This increases the transparency of analyses, making findings more traceable and replicable, thereby increasing the persuasiveness of the research.
Weaknesses:
-
For the analysis to be meaningful, there need to be at least 10 cases and enough diversity of inputs and outcomes within the cases to identify a plausible causal relationship.
-
Evaluators need to collect data on a wide range of inputs for each case. Often these data can be difficult or even impossible to collect.
-
QCA is relatively complicated and the evaluation team needs to have a thorough understanding of the approach. The method depends on the evaluator’s expertise when choosing inputs and making simplifying assumptions. This opens up the possibility of the evaluator’s subjectivity affecting the outcome.

-
Commonly used software packages like fs/QCA take time to learn and their output is not easily understood by someone without training. At times, the software will need the evaluator to make choices between different options and without solid QCA knowledge, this may lead to inaccurate outcomes.
-
Because a QCA evaluation can take many iterations before its findings are settled on, the approach can take too much time and be too costly for non-profits that need answers quickly and have limited budgets.
8. Conclusion
QCA is a valuable complement to existing M&E methods. By combining the strong points of both qualitative and quantitative approaches, evaluators can gather in-depth insights into individual cases whilst at the same time identifying causal patterns that emerge across cases. In terms of complexity, QCA’s grounding in Set Theory lets the evaluator identify different combinations of causal inputs capable of generating the same outcome. In other words, it can break down real-world cause-and-effect relationships that other analysis methods are unable to do.
We at Firdale Consulting are keen to see where QCA can take us and our non-profit clients. Let us know if you have any questions or comments.
9. References
Baptist, C. & Befani, B. (2015). Qualitative Comparative Analysis – A Rigorous Qualitative Method for Assessing Impact. Coffey How To. Accessed: https://www.betterevaluation.org/en/resources/guide/qcr_a_rigorous_qualitative_method_for_assessing_impact
INTRAC. (2017). Qualitative Comparative Analysis (QCA). Accessed: https://www.intrac.org/wpcms/wp-content/uploads/2017/01/Qualitative-comparative-analysis.pdf
Scholz, Kirbyshire & Simister. (2016). Shedding light on causal recipes for development research uptake. INTRAC. Accessed: https://cdkn.org/wp-content/uploads/2016/05/Applying-Qualitative-Comparative-Analysis-to-understand-reasons-for-research-uptake.-Vera-Scholz-Amy-Kirbyshire-and-Nigel-Simister.pdf
Rabin, C. (2008). What is Qualitative Comparative Analysis (QCA)? University of Arizona. Accessed: http://eprints.ncrm.ac.uk/250/1/What_is_QCA.pdf
Legewie, N. (2013). An Introduction to Applied Data Analysis with Qualitative Comparative Analysis (QCA). Forum: Qualitative Social Research. Accessed: https://www.qualitative-research.net/index.php/fqs/article/view/1961