The 5 steps to survey design
The 5 steps to being a data-driven non-profit
Tyryn Carnegie
Organisations, including non-profits, need to make good decisions timeously. This has often meant leadership making decisions using intuition and experience, the best available tools at the time. However, as research has shown, we often trust our intuitions even when they are wrong, and this misplaced trust can be strengthened through feedback loops constrained by our own experienced. So we need a better way to make decisions that is unobstructed by the biases and noise that affect decision-making based on intuition and experience. Data-driven decision-making (DDDM) is one such option and this blog discusses what DDDM is, why this framework is so useful, the steps an organisation needs to follow to adopt DDDM, and lastly examples of non-profits that have benefitted from DDDM.
What is DDDM?
DDDM is defined as making decisions based on hard data rather than intuition, experience, observation, or guesswork. It is a decision-making process that involves collecting and aggregating data, extracting patterns or facts from that data, and utilizing those facts to validate a course of action before committing to it.

While data has always been a tool to inform the decisions an organisation makes, its relative importance has only really taken off in the last decade. This is due to several reasons, the key one being that in the past, relevant data was more difficult and costly to obtain so intuition and experience were the most easily available tools. However, due to advances in data collection tools and data storage technology, the amount of data produced and available has increased exponentially – 90% of data available today was only created in the past 2 years! It has never been easier and cheaper (and will only get more so), for organisations of all types and sizes to collect, analyse and interpret data into real, actionable insights.
Better organisations use DDDM, including non-profits
Better organisations use DDDM. Among corporations, evidence shows that industry leaders are more likely to use DDDM than their industry laggards. For non-profits, DDDM can help improve work efficiency, help cut costs, manage donors, and even help predict the future. Being data driven also allows organisations to be proactive rather than reactive to changes in the environment in which they operate. While non-profits typically use evaluations to let them know which activities had worked as intended, more regular DDDM can provide them with a predictive outlook (read more).
How to be a data driven non-profit
Developing a DDDM culture starts with the non-profit’s leadership. Leaders must welcome analytics and use data when making decisions, and staff should be encouraged to ask questions and challenge data. Appropriate access to data and the tools to analyse it should be provided to staff at all levels. Moreover, non-profits should not rely solely on data when making decisions: good decisions made timeously requires balancing data analysis with judgement.
There are 5 general steps that data-driven non-profits take. To illustrate the process of becoming a DDDM non-profit, let’s take a fictional non-profit called EarlyEats which has the mission to improve early learning outcomes by providing free lunches to children in early childhood development (ECD) centres across South Africa.
EarlyEats has made impressive impact in a short space of time, with the non-profit reaching over 1,000 children in only 5 years. However, as their reach has expanded it has become increasingly difficult for its founders to ensure all the ECD centres receive enough meals timeously, that they are getting the best prices for the items included in the meal packs, and that their meal packs offered the best possible nutrition. After hearing about the success growing corporations and non-profits have had with DDDM, EarlyEats decides to adopt it.
Let’s look at the 5 steps EarlyEats took:
1. Know your organisation's mission
A non-profit’s first step is to establish and gain a thorough understanding of their Theory of Change. Doing so enables them to formulate the questions that will inform their strategy and lets them streamline the data collection process and avoid wasting resources.
After workshopping with all their staff, EarlyEats formulates the following questions to guide their strategy:
-
Do all the ECD centres we serve receive enough meals?
-
Are the meals received before the start of each school day?
-
Is EarlyEats getting the best possible prices for the items included in the meal packs?
-
Do the meal packs offer the best possible nutrition for children at ECD ages?
Before, EarlyEats would assume that ECD centres received enough meals timeously unless they received complaints, and the founders trusted that their management experience and acumen was enough to ensure that their distribution system was as efficient as possible. For this blog, let’s just look at how EarlyEats uses DDDM to answer the question in the first bullet.
2. Identify data sources
The non-profit’s next step is to identify the data sources that will help answer their strategy informing questions. Potential data can be available to the public (such as the datasets found on DataFirst), or may require the non-profit to collect data themselves through applications, surveys, their own financial records, or through other ways their organisation routinely collects data. Sources can either be quantitative data, which is data expressed in numbers, or qualitative data, which is data expressed in words.
EarlyEats identifies the following data sources:
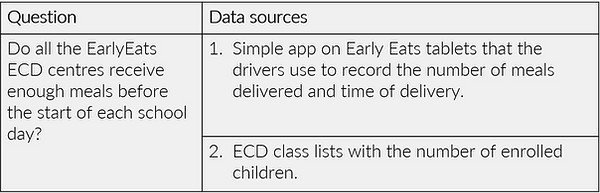
By combining the EarlyEats delivery app and class list data, EarlyEats could track if each ECD centre received the correct number of meals at the correct time.
3. Clean and organise data
Data cleaning is the process of preparing raw data for analysis by removing or modifying data that are incomplete, irrelevant, duplicated or improperly formatted. The result is usually a data table (like an Excel spreadsheet), with all relevant data organised so that statistical analysis is possible and accurate.
After each delivery, the EarlyEats’ delivery app saved data into a dataset containing information on total meals and delivery times for all drivers. These data needed to be combined with the ECD class lists, cleaned, and organised to allow for statistical analysis.
Cleaning data takes a surprising amount of time, with 80% of time usually spent on cleaning data and 20% of time spent doing analysis.
Data cleaning is crucial to ensuring the analysis is meaningful and although data cleaning can be done manually (for instance in Excel) standardising this process through data cleaning code (such as Stata, R or Python) is very beneficial as this reduced scope for human error and speeds up the process. EarlyEats therefore decided it was more efficient to hire external data analysts than to do the data cleaning themselves. For more information reach out to us at megan@firdaleconsulting.co.za.
4. Perform statistical analysis
After the data has been cleaned and organised, the data analysts are ready to generate statistics and visualisations to answer EarlyEats’ questions. There are two main types of data analytics:

EarlyEats opted for a descriptive statistic bar graph which is displayed on their analytics dashboard:

The graph revealed that in February:
-
Rainbow and Sunbeams received the correct number of meals
-
eKhaya received 100 too few meals
-
Grow Educare received 200 too many meals
The above findings showed EarlyEats the problem areas so they could focus their attention on the two ECD centres with misallocated meals and try get to the root of the problem.
Data analytics requires some expertise in statistics, data analysis, data visualisation and data storytelling. Each non-profit must decide what data analytics they will conduct themselves and when to hire external consultants. For instance, EarlyEats may feel comfortable producing the chart presented above (e.g. using Excel). Conversely, more sophisticated analysis, such as predictive modelling or delivery route optimisation, may require external consultants. Some non-profits may also benefit from a live data dashboards, particularly if data are continuously being submitted (e.g. the meal delivery data). Dashboards can help non-profit staff make timeous decisions. Building a live dashboard may also require external consultants (please get in touch with us at megan@firdaleconsulting.com if you feel this would be useful for you).
5. Draw conclusions and take action
In the final step, non-profits need to review the data analysis and make data-driven decisions. What new information was learnt from the data? What additional data are required? What actions can be taken? The conclusions drawn will help the non-profit make more informed strategic decisions.
From the data analysis, EarlyEats identified eKhaya and Grow Educare had misallocated meals in February. To understand why, EarlyEats collected additional qualitative data through interviews.
They found eKhaya’s manager believed she could ask for a maximum of 45 meals a day. After clearing up that misunderstanding, EarlyEats made sure eKhaya received their 60 meals each day.
Grow Educare consistently received too many meals. EarlyEats found the extra meals were being shared among the ECD centre’s staff. While the meals were only intended for the centre’s children, this finding led to a discussion among EarlyEats’ leadership of whether ECD centre staff meals should also be supplemented.
Real world examples of data-driven non-profits
Following the lead of companies, there is a growing number of non-profits adopting DDDM. The Akshaya Patra Foundation, an Indian non-profit that delivers midday meals to government schools, used data analytics in two ways. Firstly, they found the optimum delivery routes through data analysis which resulted in a saving of almost $20 000 every month. Secondly, Akshaya found the most cost-effective way of raising donations was through internet funding rather than by liaising with a few high net-worth individuals, and therefore adjusted their fundraising strategy.
CHOICE Humanitarian conducts regular surveys among Nepalese households to track the effectiveness of their programmes. One such programme was the provision of cooking-gas producing biodigesters to replace firewood. After a year of the programme’s implementation, CHOICE Humanitarian analysed their data and found only 1/3 of the biodigesters were still in use. By using the households’ data from the survey, the non-profit was able to identify the need for a train-the-trainers programme for biodigester maintenance.
While there is a lot of data on chimpanzee behaviour, the Jane Goodall Institute (JGI) required information on the extent of deforestation in their habitats. To fill this gap, JGI recruited villagers who mapped out their local ecosystems using Google Earth Engine and Open Data Kit. By analysing these data, JGI found 2.4% of forests within the chimpanzee’s range were destroyed between 2000-2012. This led the institute to set a 30-year goal to protect 85% of chimpanzees in their native habitats.
Conclusion
DDDM is a decision-making method that encourages the use of hard data to guide decision-making rather than less reliable but traditionally used methods such as intuition or experience. Technological advances that have lowered the cost of collecting, storing, and analysing data have meant DDDM is a worthwhile endeavour for all types of organisations, including non-profits such as the Akshaya Patra Foundation, CHOICE Humanitarian, and JGI. However, for a non-profit to effectively adopt DDDM and become a better and more efficient organisation, it should carefully follow the five steps highlighted in this blog: 1. Know'it's mission, 2. Identify data sources, 3. Clean and organise data, 4. Perform statistical analysis, 5. Draw conclusions and act.